Open-Sourced Airbnb Amsterdam Data Analysis
- Objective-
- Perform an initial data and exploratory analysis of Airbnb’s data from the city of Amsterdam, using Python, to derive insights and suggest marketing strategies. (Project brief)
- Skills-
- Sourcing Open Data
- Exploring Relationships
- Geographic Visuals with Python
- Supervised Machine Learning: Regression
- Unsupervised Machine Learning: Clustering
- Sourcing and Analyzing Time Series Data
- Creating Data Dashboards
- Data-
- Inside Airbnb – Open-sourced data provided by Airbnb
- Tools-
- Excel
- Python
- Seaborn
- Matplotlib
- Pandas
- Tableau
Process Highlights
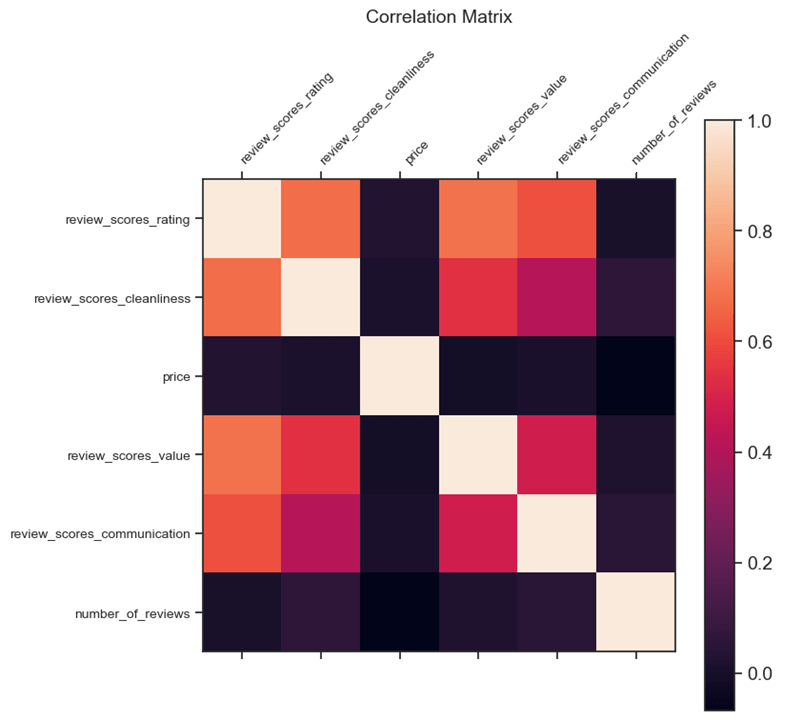
Problem: Using correlation heatmaps in Python, initial data analysis showed there were no strong correlations.
Solution: Refocused research on text and mapping.
Data insights
(To view more Python code, click here)
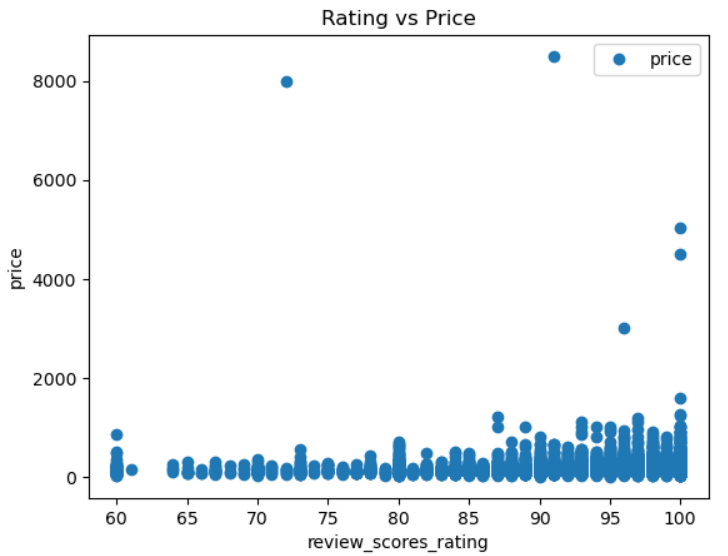
Using supervised machine learning, there is an obvious correlation between the rating of a property and the price of the property.
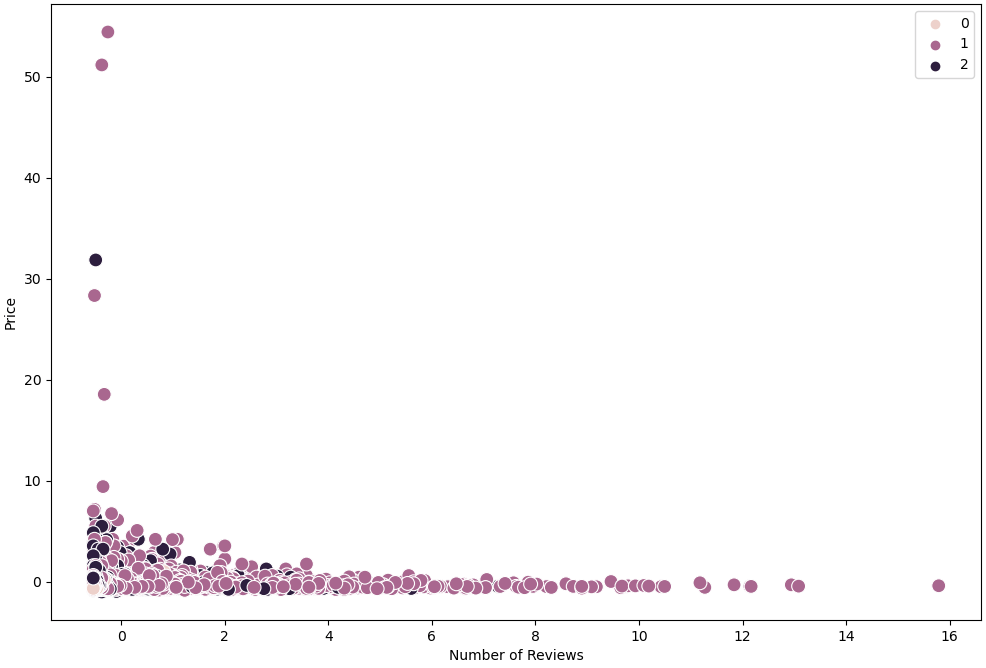
Utilizing clustered scatterplots, the data shows having more reviews does not correlate to a higher priced listing.
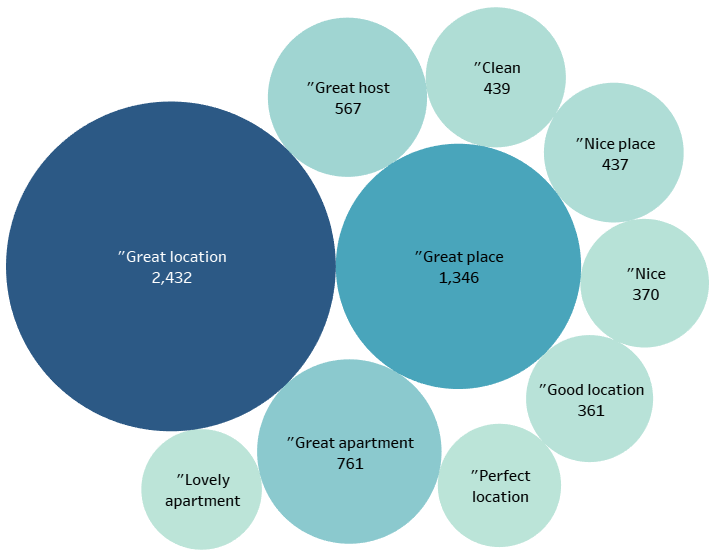
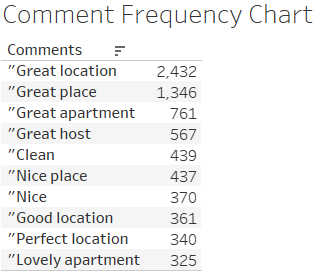
With data visualization tools, it is clear that travelers commented on location the most.
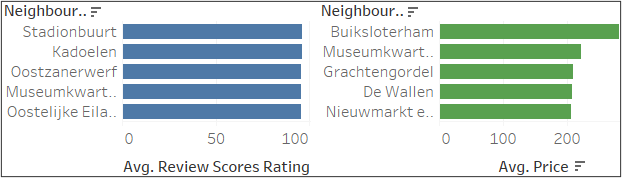
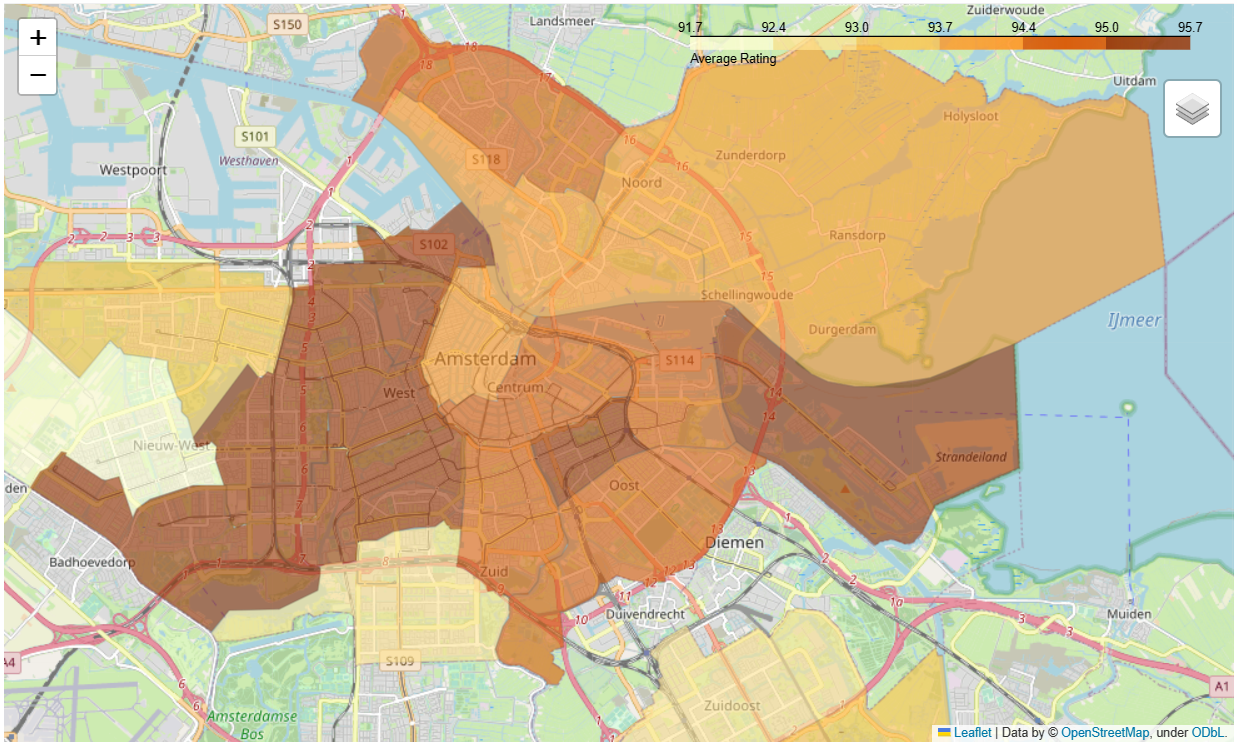
The highest rated neighborhoods are not the highest priced neighborhoods.
Recommendations
Tableau Dashboard (Final report)
- Reformat Platform
- Reconfigure the website and app to highlight a location or neighborhood’s attractions to funnel travelers to more profitable listings.
- Targeted Marketing
- Emphasize location in advertising. Location was the aspect of their experience most commented on by travelers.
- Restructure Pricing for Highly Rated Neighborhoods
- Identify price ceiling for listings in popular neighborhoods.
