Preparing for influenza season Analysis
- Objective-
- Proactively plan for staffing needs across the country based on trends in influenza. (Project brief)
- Skills-
- Translating Business Requirements
- Data Cleaning
- Data Transformation & Integration (Pivot Tables and VLOOKUP)
- Statistical Hypothesis Testing
- Visual Analysis
- Forecasting
- Spatial and Textual Analysis
- Storytelling with Data Presentations
- Data-
- Influenza deaths by geography, time, age and gender– provided by CDC
- Population data by geography– provided by CDC
- Survey Data on influenza visits– provided by CDC
- Survey Data on lab tests– provided by CDC
- Survey of flu shot rates in children– provided by CDC
- Tools-
- Microsoft Excel
- Microsoft Word
- Tableau
Process Highlights
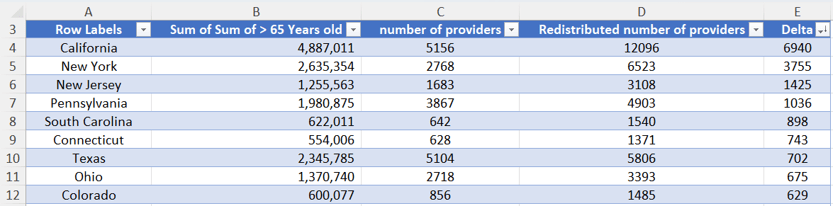
Problem: Utilizing staff without additional resources.
Solution: Redistributed staff using delta method.
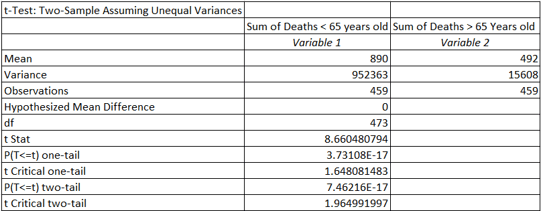
Problem: The age of individuals who should be considered high risk was unknown.
Solution: Performed statistical hypothesis testing with t-Test.
Data insights
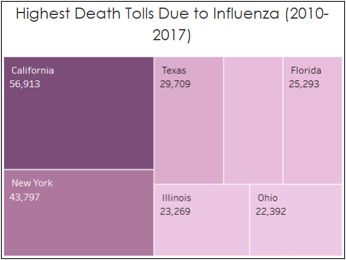
Deaths due to influenza do not correlate to any region.
Deaths due to influenza do not correlate to any region.
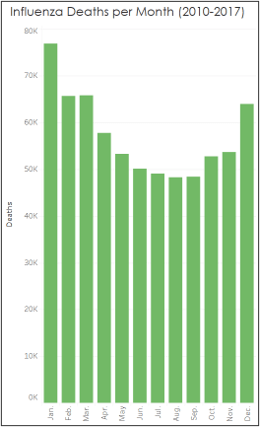
Influenza “season” begins in October and ends in March.
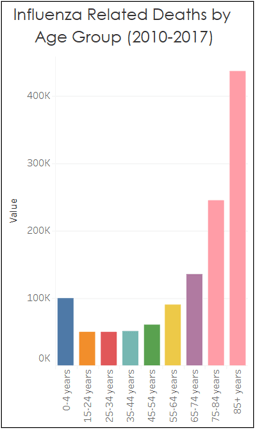
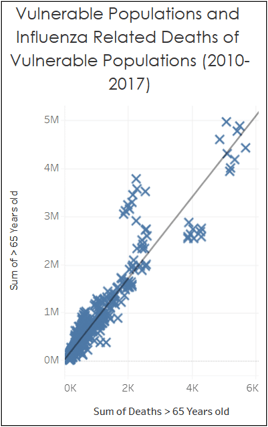
Individuals 65 years old or above should be considered most vulnerable to the flu.
Recommendations
Tableau reporting (Final report)
- Reallocate Funds
- Redistribute resources to states that have higher death tolls and higher populations of vulnerable individuals. Survey staff members on whether some employees would be willing to relocate to states that need more providers.
- Emphasize Seasonality
- Have more staff available during influenza “season”, which is October through March.
- Further Research
- Exam how other countries around the world treat influenza. If they have a higher success rate, explore their methodologies.
