Instacart Grocery Basket Analysis
- Objective-
- Derive insights and suggest strategies for better targeted marketing, using Python. (Project brief)
- Skills-
- Data Cleaning: Wrangling and Subsetting
- Data Consistency Checks
- Combining and Exporting Data
- Deriving New Variables
- Grouping Data and Aggregating Variables
- Python Visualization and Excel Report
- Data-
- Customer data set– provided by CareerFoundry
- Data dictionary– provided by Instacart
- “The Instacart Online Grocery Shopping Dataset 2017”– provided by Instacart
- Tools–
- Excel
- Python
- Numpy
- Matplotlib
- SciPy
- Pandas
- Seaborn
- Tableau
Process Highlights
Problem: Data was spread out throughout multiple databases, some of which contained inconsistencies.
Solution: Merged and cleaned multiple databases.

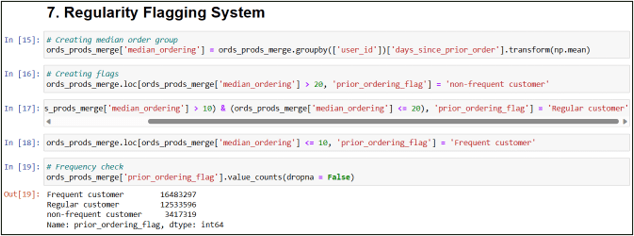
Problem: Categories of interest were not available.
Solution: Created categories using “If” statements and “loc()” functions.
Data insights
(To view more Python code, click here)
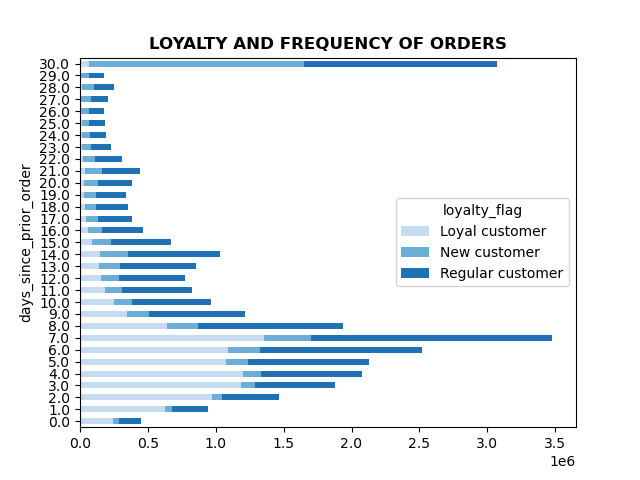
Loyal customers go no longer than 7 days between orders.
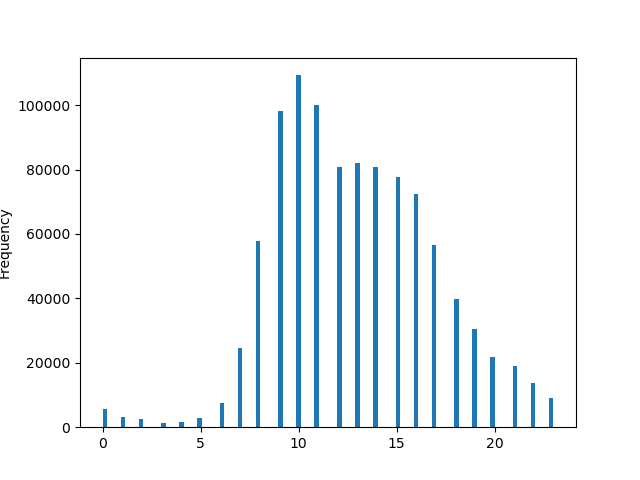
The majority of orders take place between 9am-3pm.
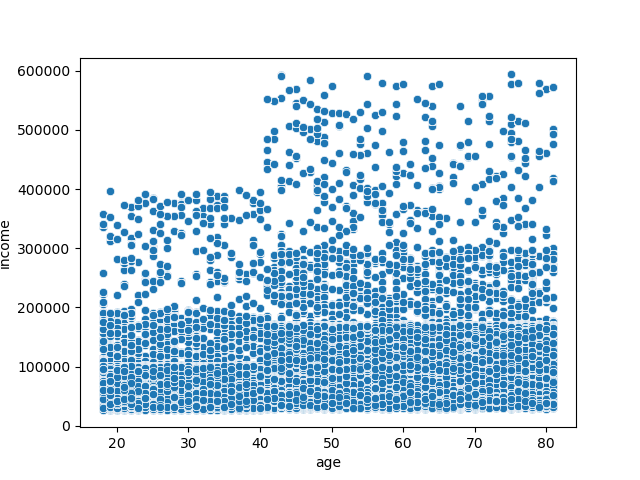
Customers above the age of 40 have much more spending power than those below 40.
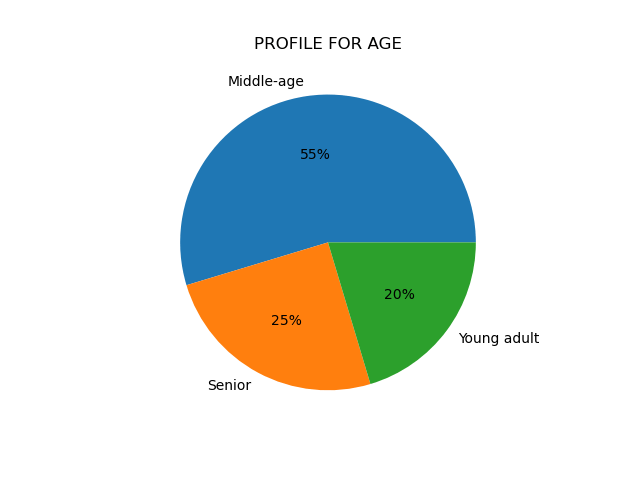
The majority of shoppers are middle-aged.
Recommendations
Excel reporting (Final report)
- Create a Loyalty Program
- Convert new and regular customers into loyal customers by incentivizing their next order within in 7 days.
- Targeted Marketing
- Higher priced items should be advertised towards an age demographic of 40 years of age and above, due to their higher spending power.
- Advertising
- Commercials/advertisements should take place during off-peak hours (3pm-9am)
